Square-friendly imports
Bring in sales from the Square exports you already use and turn them into connected sales, products, locations, and events.
CottageOps brings together sales, expenses, products, customers, and events so small food businesses can see what is working, what needs attention, and what to do next.
You should not need a perfect spreadsheet system before you can use business software. CottageOps works with the information small operators already have: Square exports, spreadsheets, receipts, invoices, PDFs, screenshots, and quick notes.
Less cleanup before CottageOps. More useful data inside CottageOps.
Bring in sales from the Square exports you already use and turn them into connected sales, products, locations, and events.
Give CottageOps a messy sales, product, expense, or event spreadsheet and let it organize the data into structured records.
Turn receipts, invoices, screenshots, PDFs, and rough expense notes into expense records without typing everything by hand.
CottageOps does not treat each record like an isolated spreadsheet row. It connects the pieces so the same data can answer more useful questions across the business.
Sales can become product performance, customer behavior, event results, concentration signals, and more.
The more of the business CottageOps understands, the more useful every dashboard and decision tool becomes.
CottageOps turns your records into a practical read on the business: what changed, what is driving the result, and which signals deserve a closer look.
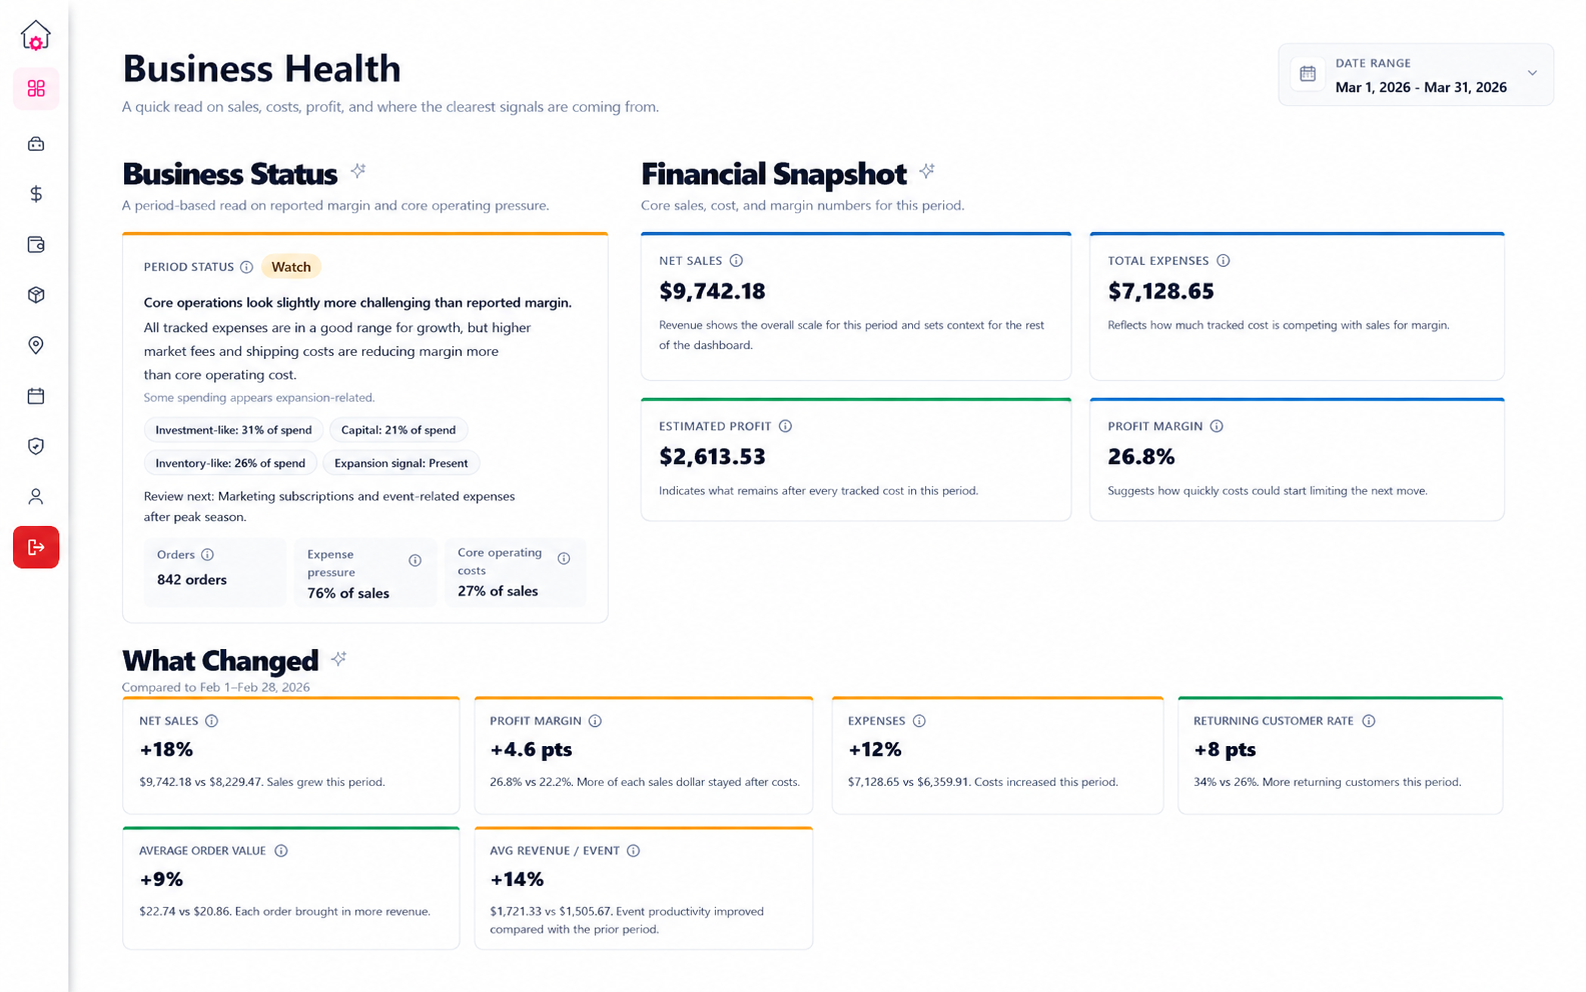
See sales, expenses, estimated profit, margin, customer strength, period-over-period changes, major business drivers, and recommended next steps.
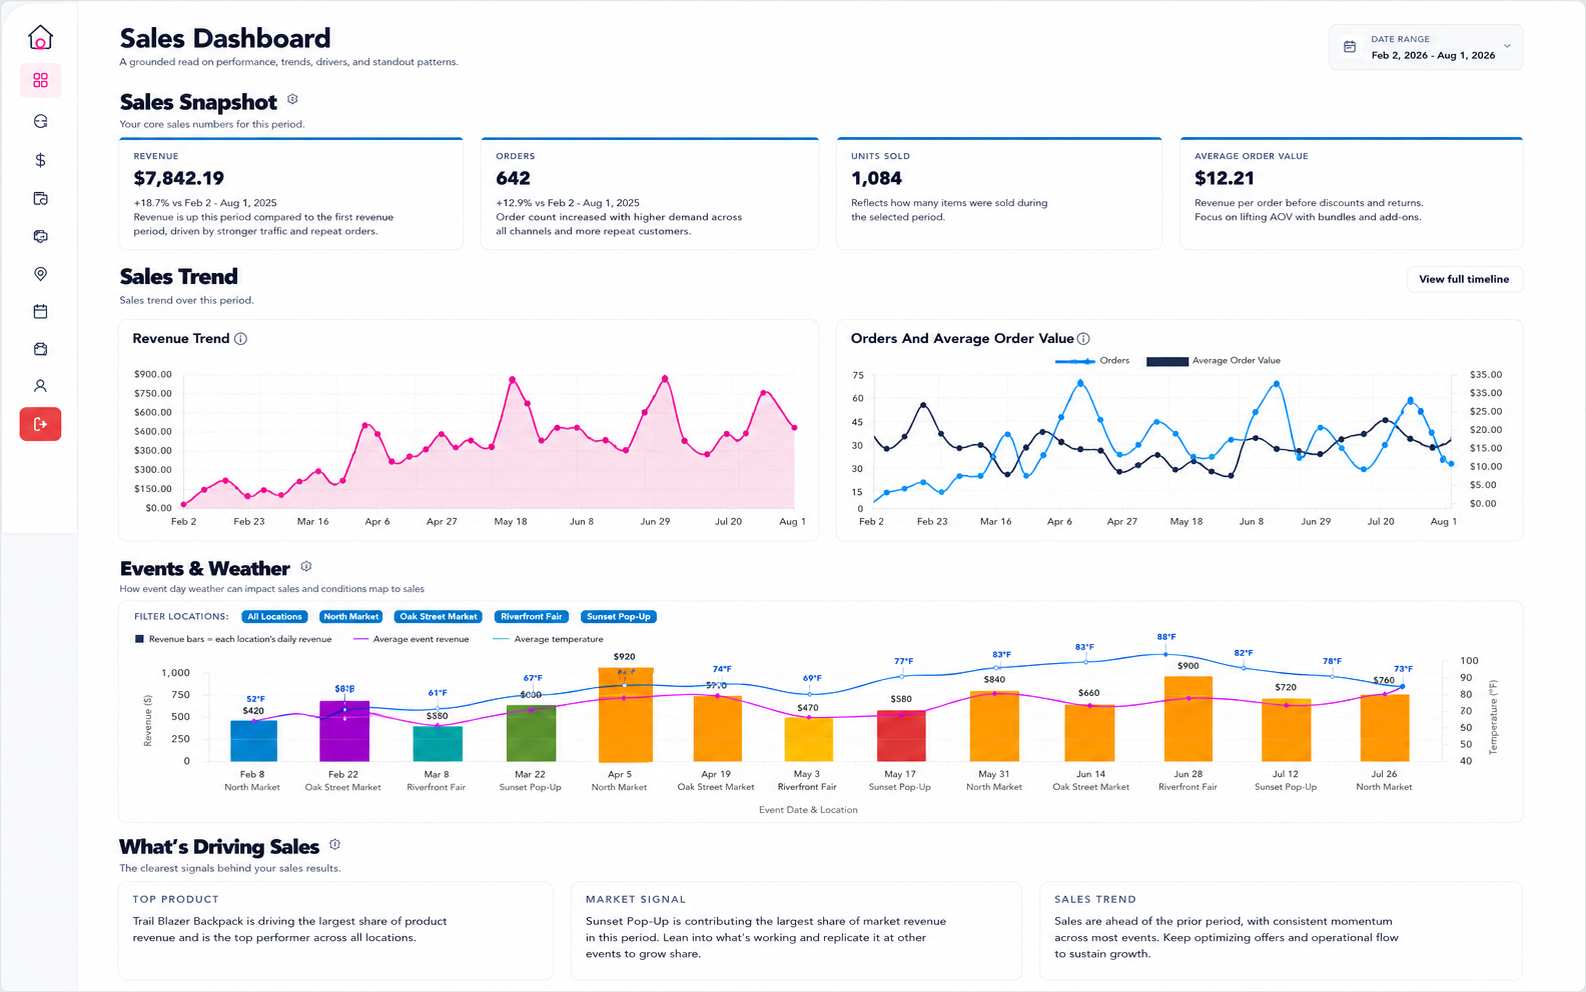
Follow sales trends, order value, repeat customers, concentration risk, market dependence, product performance, and the patterns worth watching.
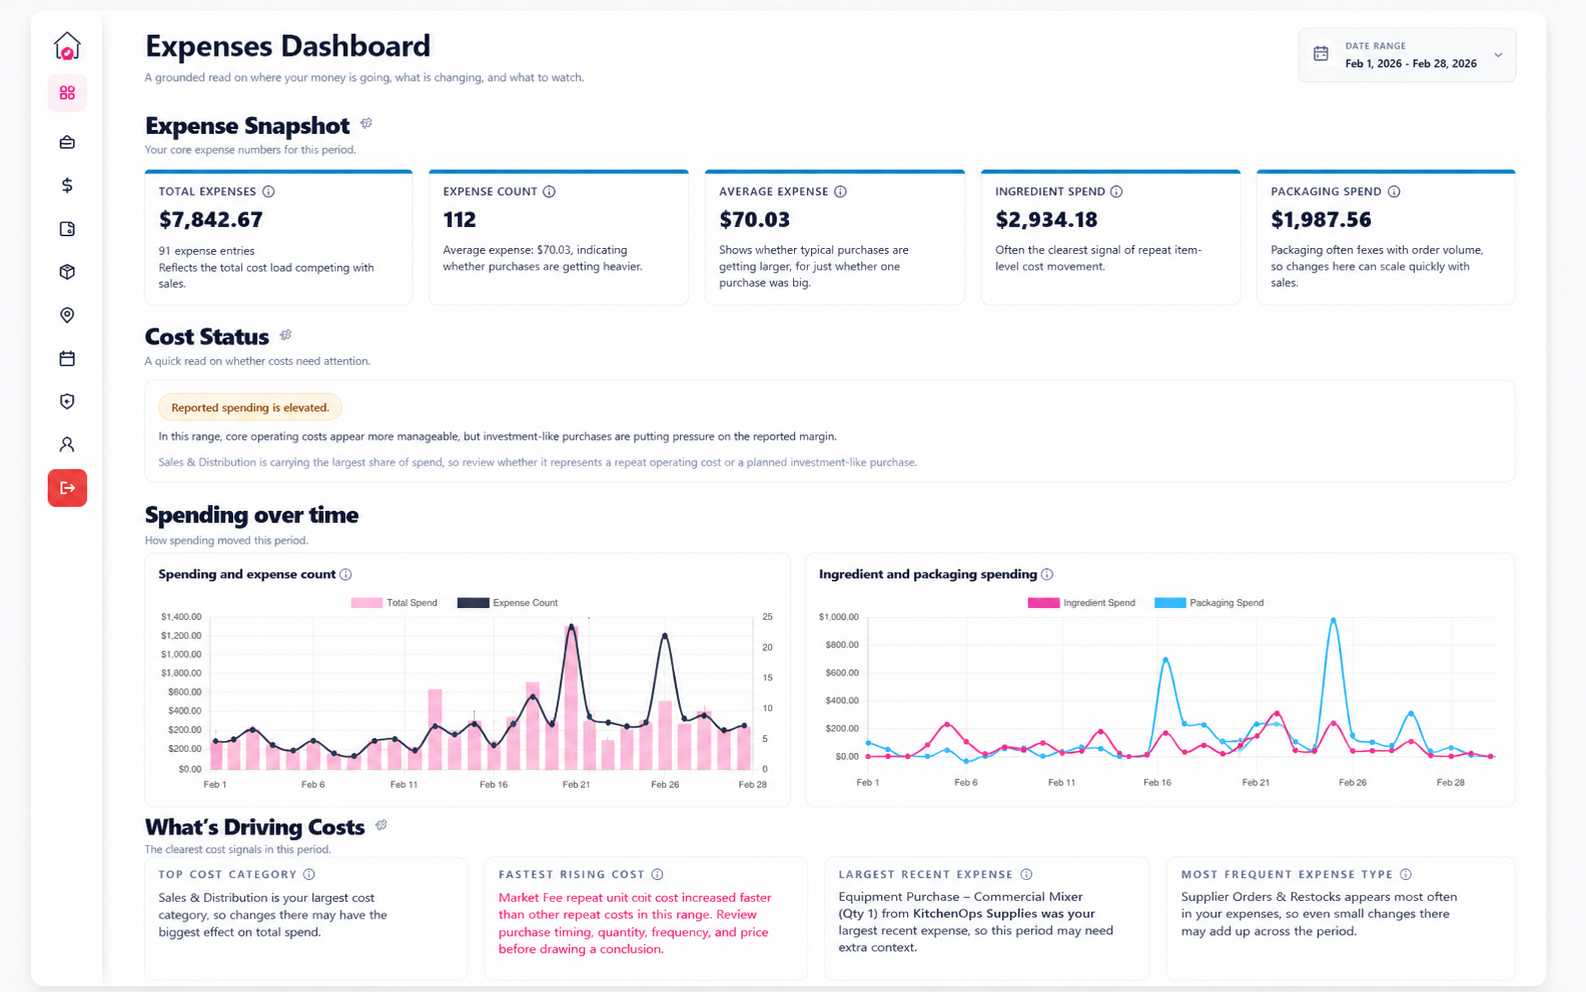
Understand spending pressure, changing unit costs, major cost areas, largest purchases, and whether spending is operational or investment-like.
Reporting is useful. Knowing what to do with it is better. CottageOps includes tools built around decisions small operators actually have to make.
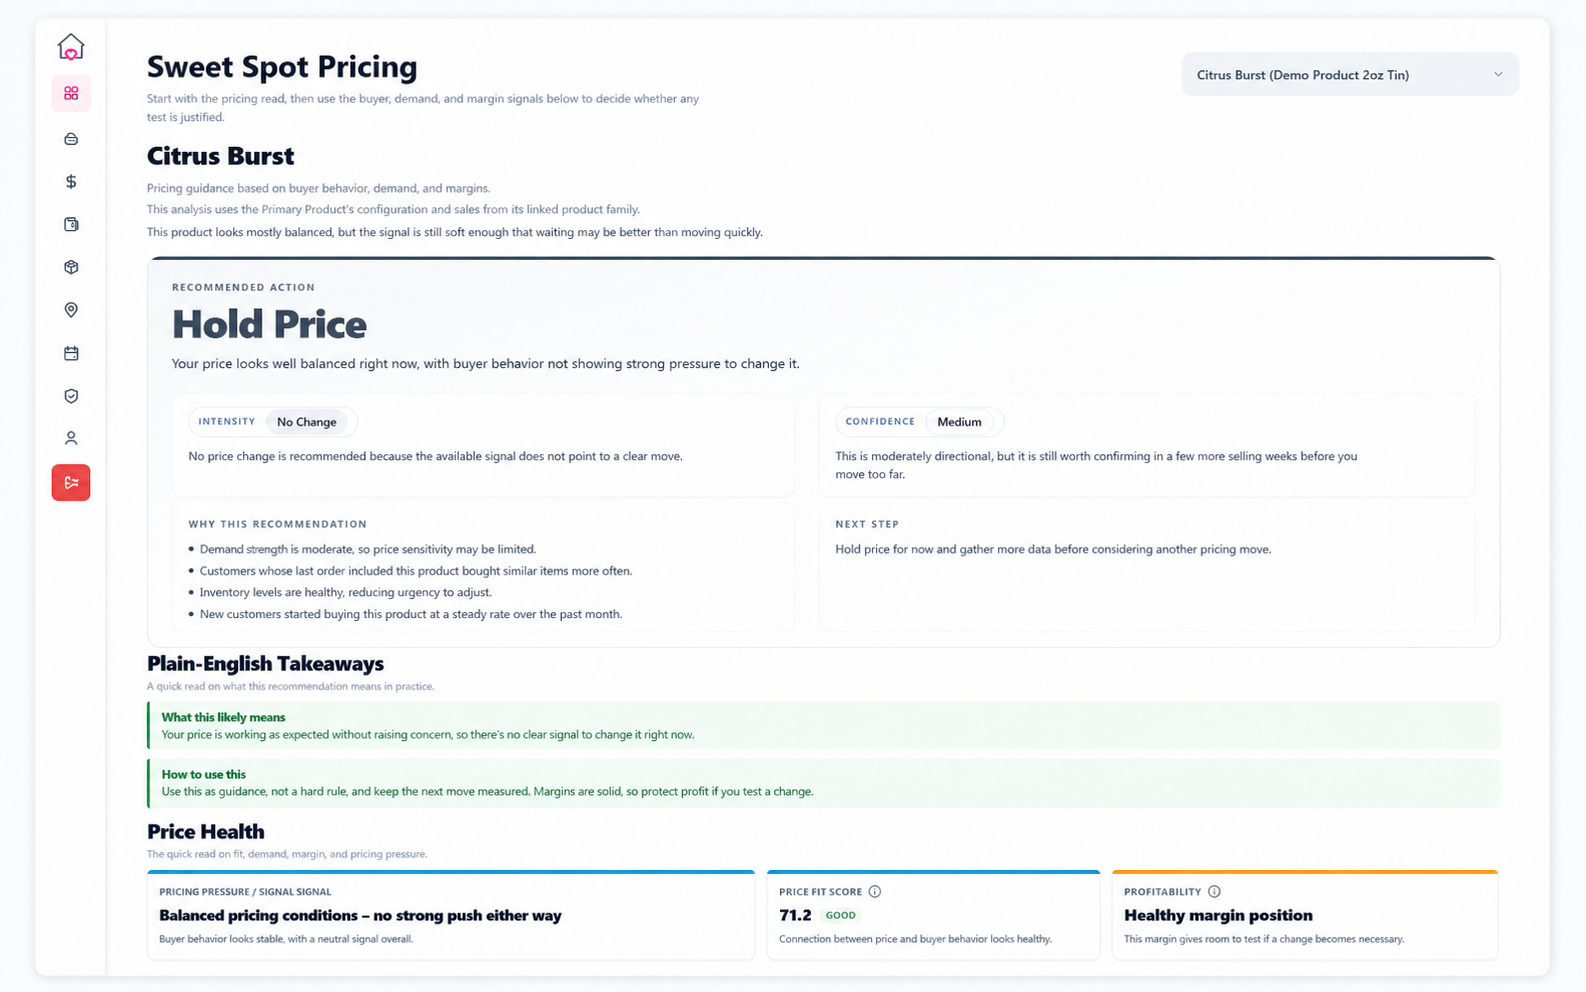
CottageOps weighs buyer behavior, demand, product economics, business baselines, and data quality before recommending whether to hold, raise, lower, or keep watching a price.
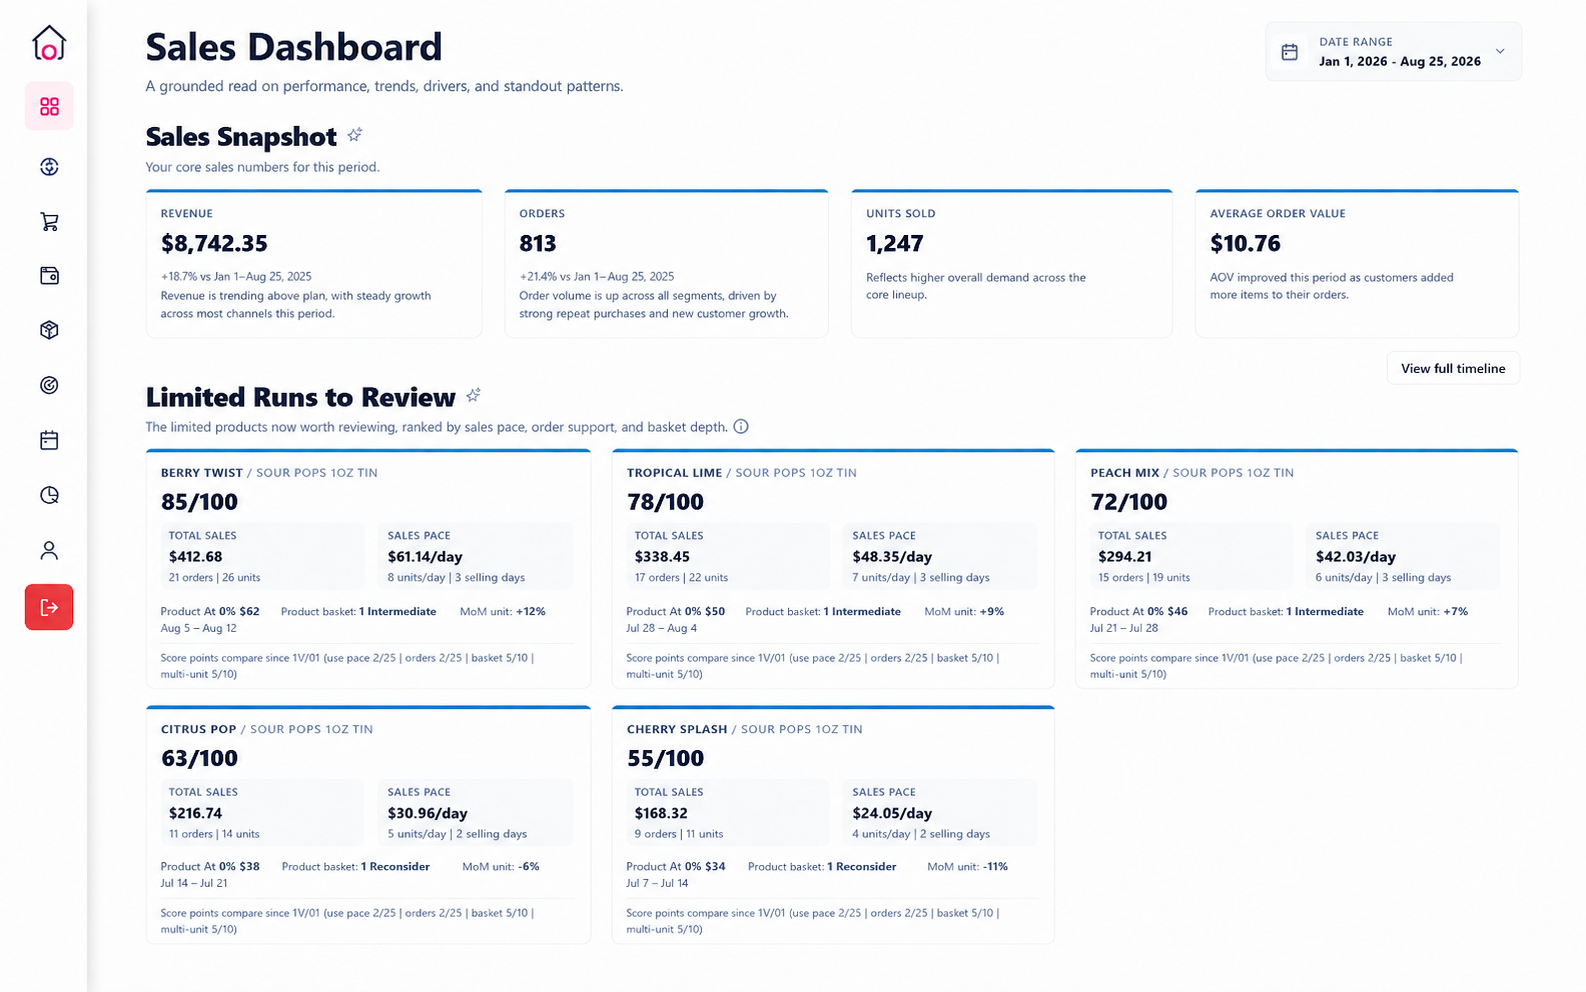
Review short-run products using sales pace, order support, basket behavior, and available selling days so you can see which experiments deserve a closer look.
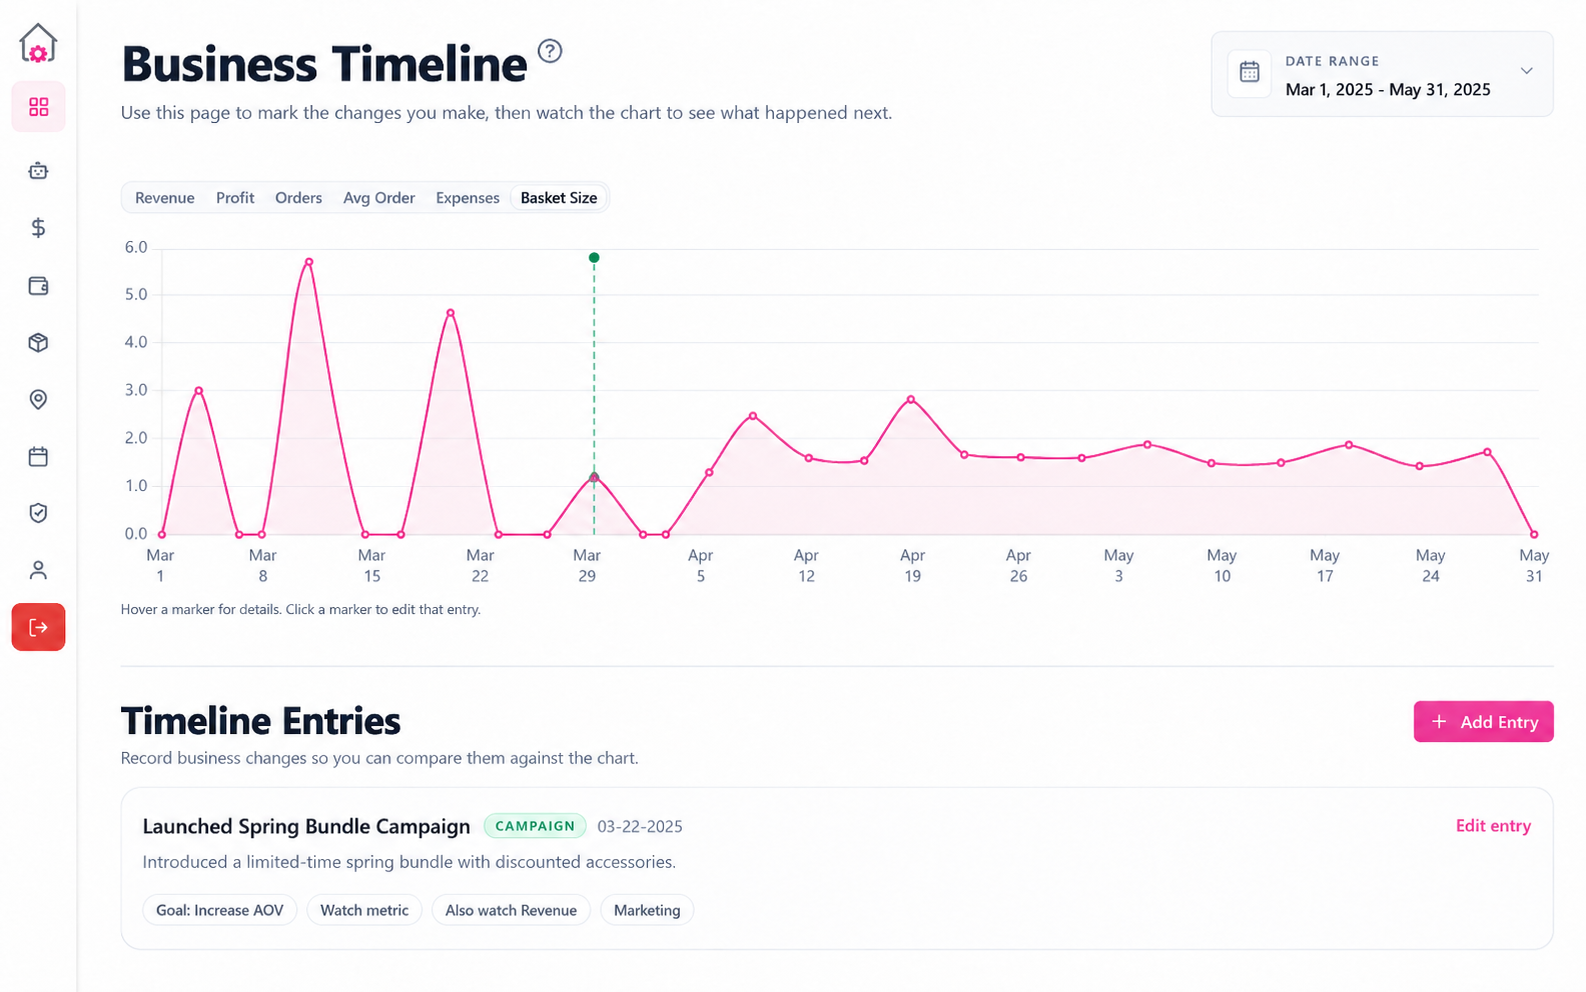
Record pricing changes, bundles, promotions, product changes, or other business decisions and compare them against what happened afterward.
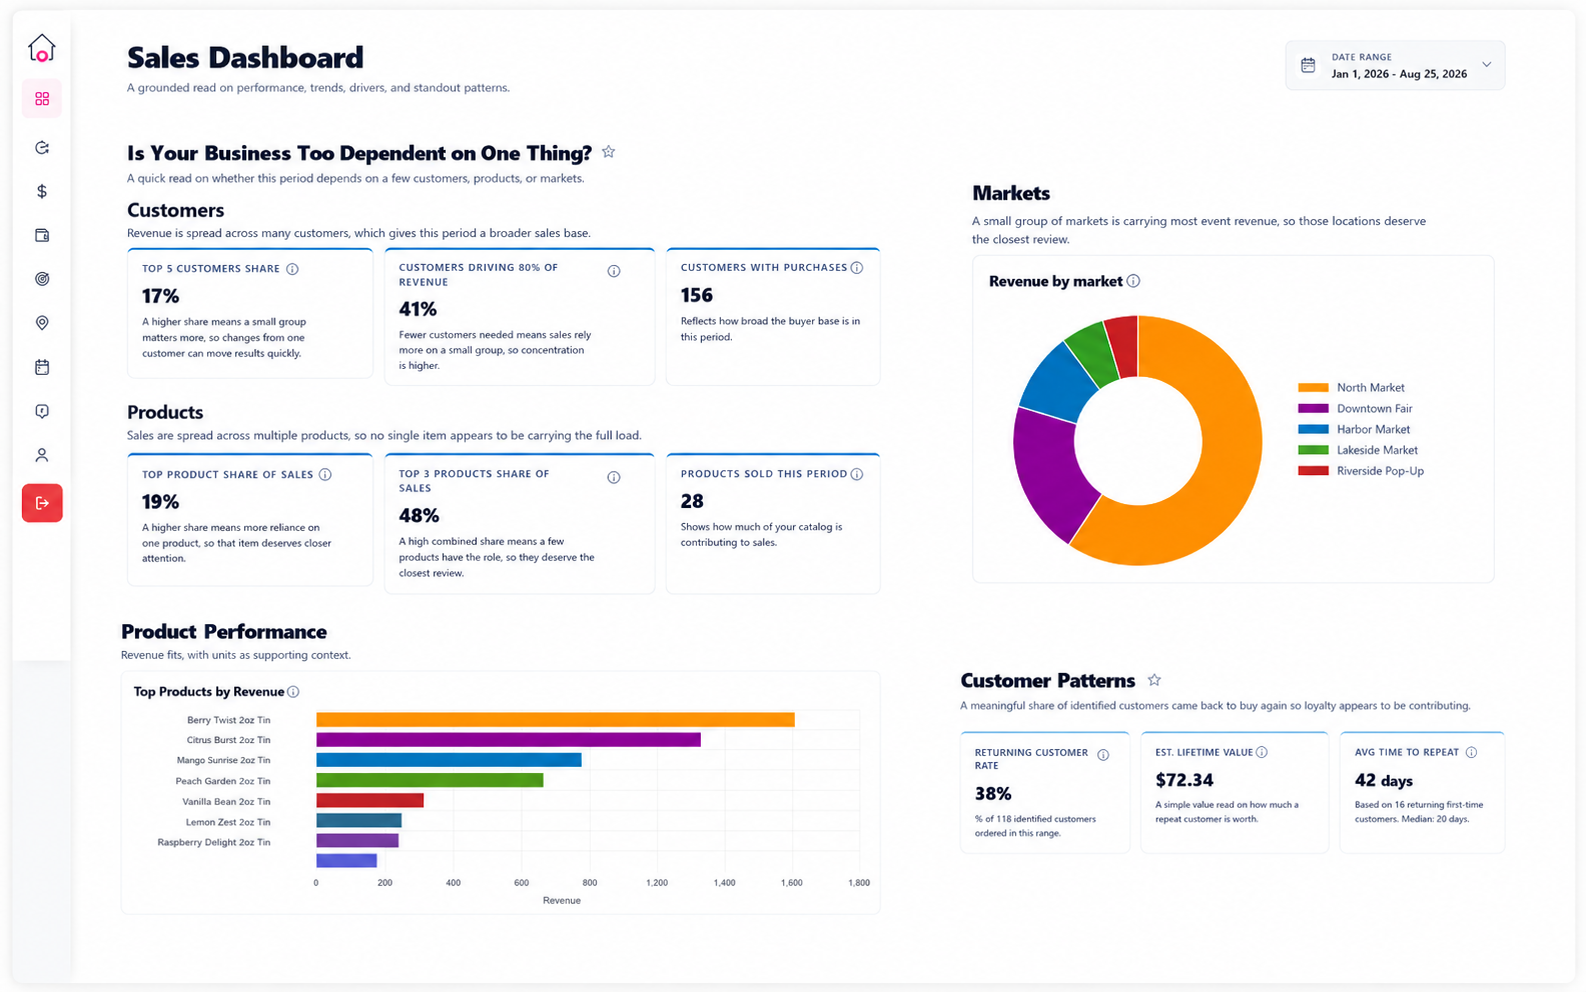
A good sales number does not tell you whether the business underneath it is healthy. CottageOps helps you see where revenue comes from, where costs are accumulating, and where dependence or opportunity may be hiding.
Repeat rate, time to repeat, estimated lifetime value, first-order behavior, and customer concentration.
Revenue, units sold, concentration, direction, limited runs, costs, and product-level performance.
Compare markets, pop-ups, locations, event revenue, average performance, and weather context.
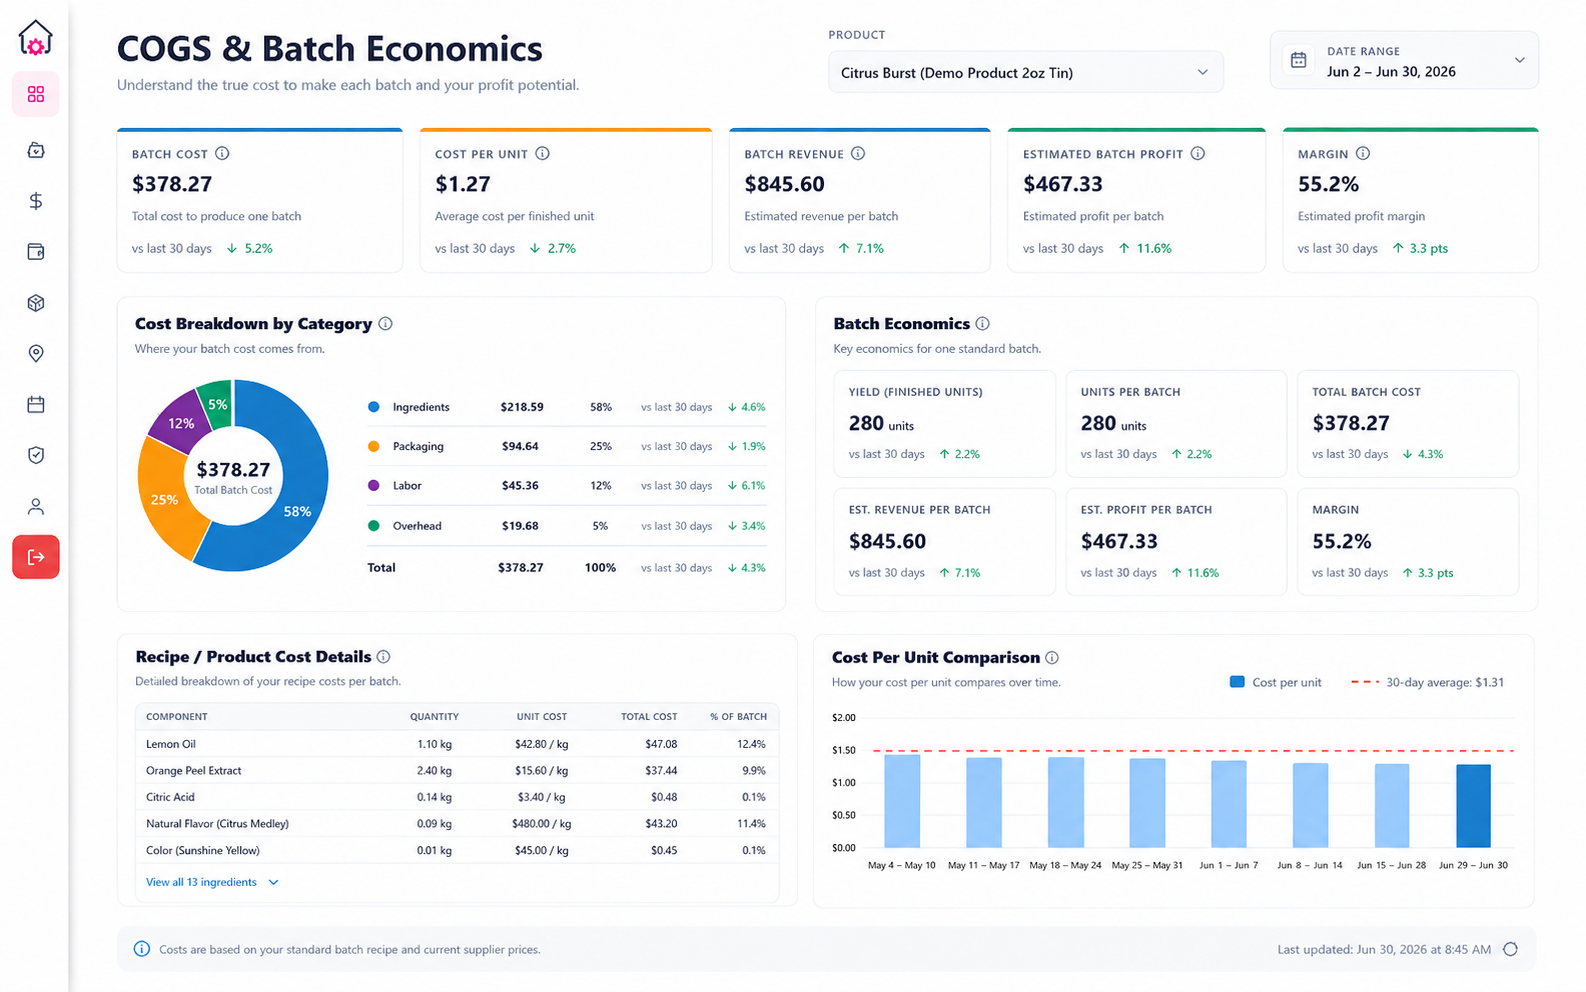
Connect ingredients, packaging, labor, batch economics, and unit costs to pricing and product decisions.
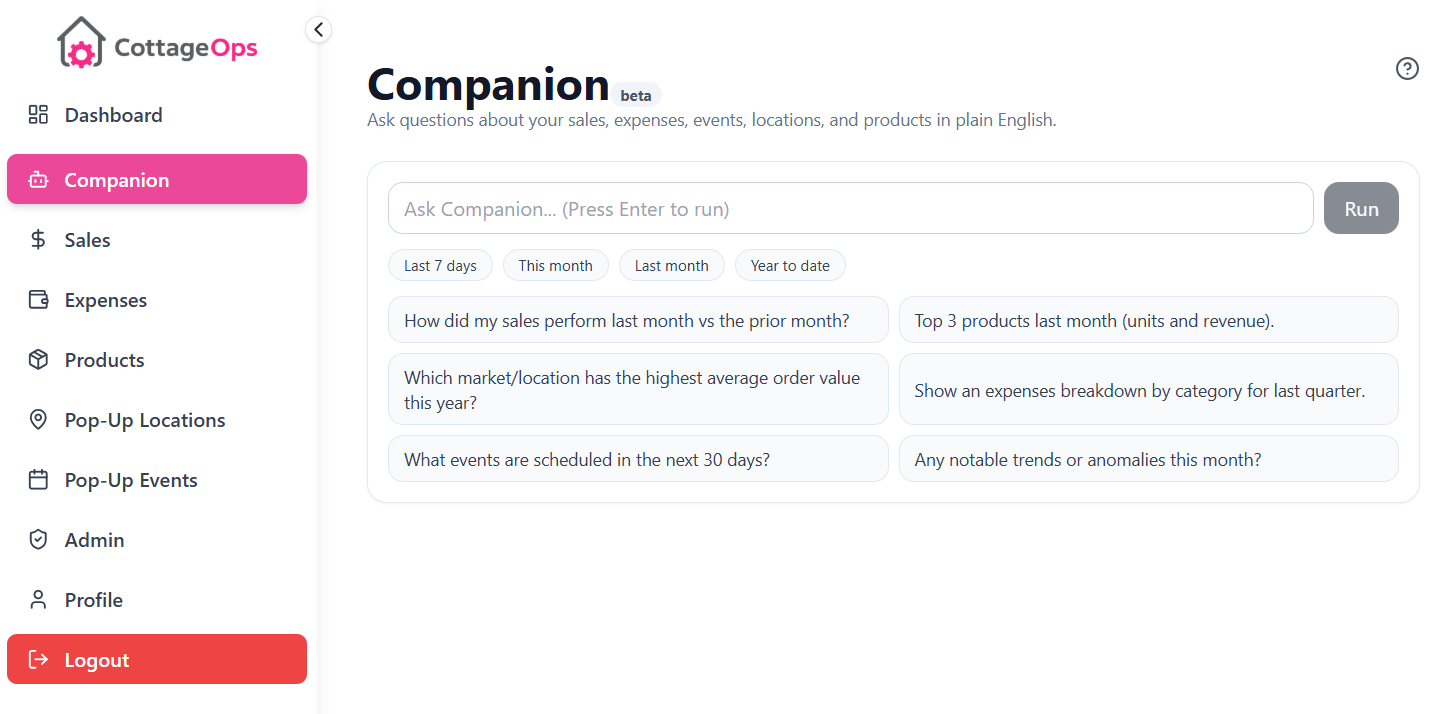
CottageOps Companion works with the business context already inside CottageOps so you can ask plain-English questions about sales, costs, products, customers, markets, and performance.
Use Companion when you want another set of eyes on what the business is doing and why.
Dashboard insights can also explain what the data suggests, what evidence supports the read, and what may be worth checking next.
AI helps you understand the intelligence. It does not replace the underlying numbers.
Bring your sales, expenses, products, and events into one place and turn the data you already have into clearer decisions.